

MARKET INSIGHTS: Tariff Trepidation
One of the focal points following the presidential election is the potential for an increase in tariffs applied to goods produced outside the US. Perhaps you have wondered what this could mean for your investments.
One period offering perspective on this issue is President Trump’s first term in office. Beginning in 2017, the administration eyed China as a target and, by 2018, began imposing tariffs across a range of products. The next couple of years saw back and forth trade discussions that eventually led to an agreement, though pre-existing tariffs remained in place. Despite all this uncertainty, both China and the US posted higher cumulative returns than the MSCI World ex USA Index over the four years of Trump’s term.
Markets are forward-looking, and the economic impact from initiatives such as tariffs is likely already reflected in current market prices. When these expected developments come to pass, the effect on markets and your investments may be muted.
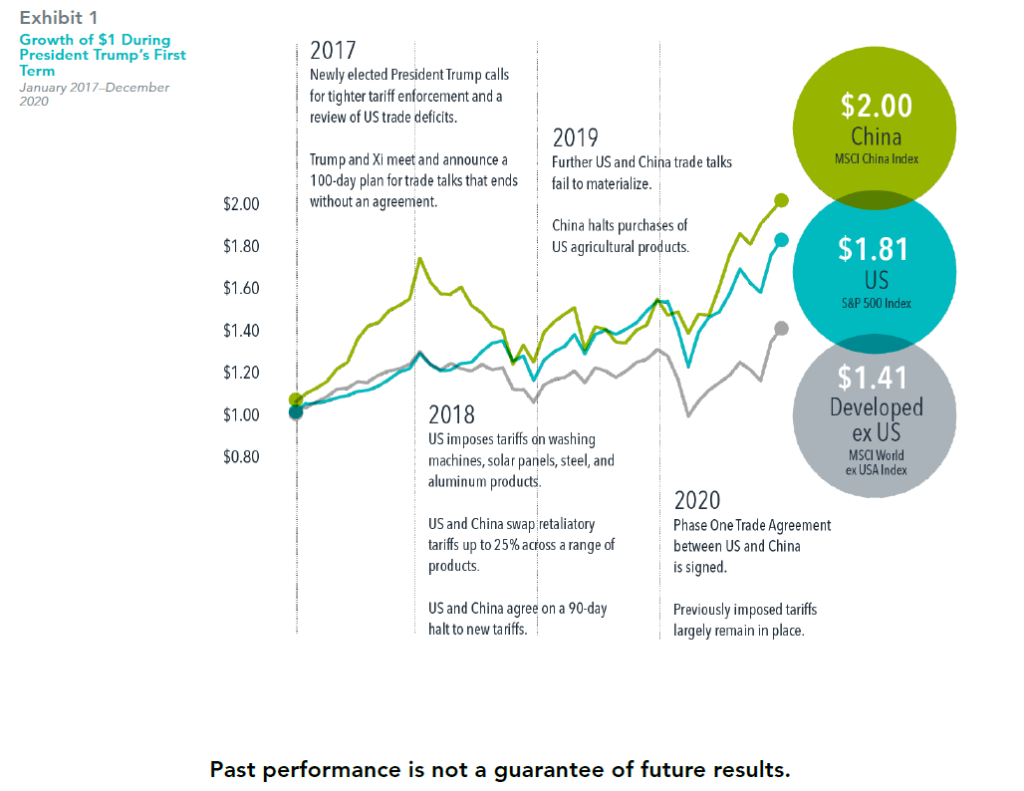
In USD. Data shown from January 1, 2017, to December 31, 2020. Growth of wealth shows the growth of a hypothetical
investment of $1. Data presented in the growth of wealth chart is hypothetical and assumes reinvestment of income and no
transaction costs or taxes. The chart is for illustrative purposes only and is not indicative of any investment. Performance
includes reinvestment of dividends and capital gains. MSCI China Index and MSCI World ex USA Index returns are net
dividend.
Tariff events data sourced from Reuters. S&P data © 2025 S&P Dow Jones Indices LLC, a division of S&P Global. All rights reserved. MSCI data © MSCI 2025, all rights reserved.
Indices are not available for direct investment: therefore their performance does not reflect the expenses associated with the management of an actual portfolio
Risks : Buying Investments can involve risk. The value of your Investments and the income from them can go down as well as up and is not guaranteed at anytime. You may not get back the full amount you invested. Information on past performance is not a reliable indicator for future performance. This information is intended for educational purposes and should not be considered a recommendation to buy or sell a particular security. The views expressed here are subject to change without notice and we can’t accept any liability for any loss arising directly or indirectly from any use of it.
To discuss your financial requirements or obtain other information click below
Share this article with your friends by clicking below
MARKET INSIGHTS: CAN YOU AFFORD NOT TO BE INVESTED?
Following on from my note earlier in the month here’s another detailed infographic on the problem of trying to predict returns or thinking it’s better to wait and choose the right time to make your investments. Although this example refers to the US Stock Market (the largest by size in the world) it can apply to many investment choices and indeed could be related to other aspects of life when it comes to predictions!
The S&P 500 Index rose by 23.3% in 2024. This far exceeded expectations from analysts polled at the end of 2023, none of whom believed the S&P would grow by its historical average rate of return,12.3%. In fact, nearly half of the analysts predicted a negative year for the index. If someone listened to those analysts they may have waited and not invested or divested from US stocks and lost out on the returns.
This dispersion in predictions highlights the challenge with making asset allocation decisions based on forecasts. Individuals arrive at different expectations because they may see the world differently. Hence we prefer to look at the evidence of returns over longer periods and consider spreading investments across a range of assets focusing on what you can control to meet your planning goals which is where we can help.
Predictions Gone Wrong: Equity analyst predictions vs. actual for the S&P 500
Index calendar year return in 2024
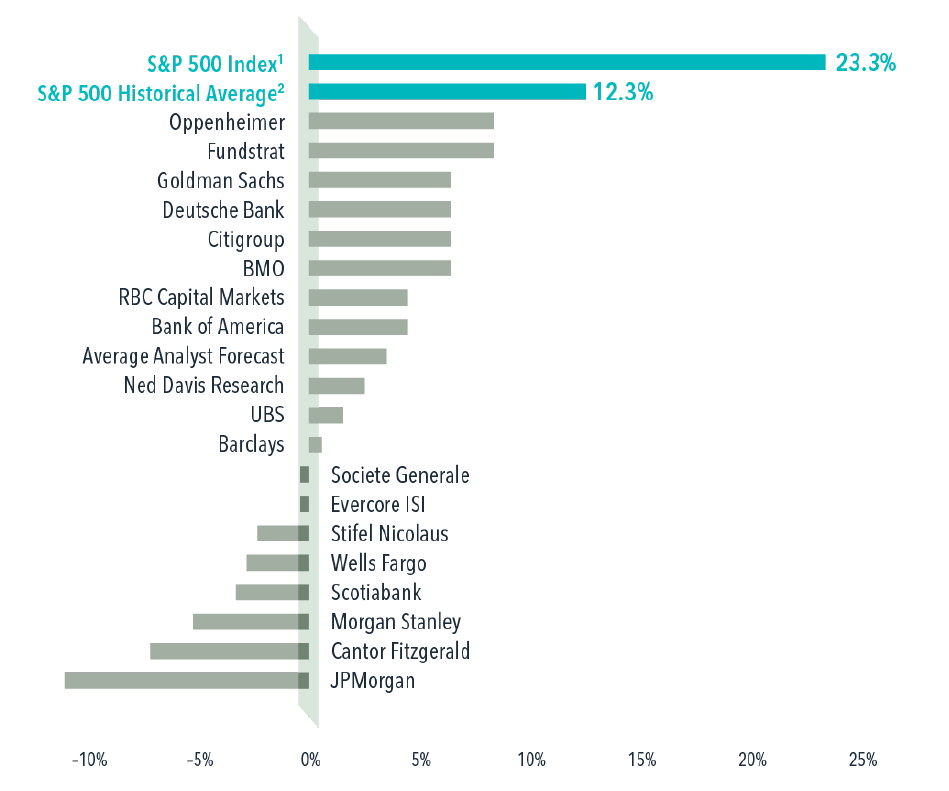
1. Price-only return.
2. Based on actual S&P 500 Index average annual total return from 1927 to 2024.In USD.
2. Based on actual S&P 500 Index average annual total return from 1927 to 2024.In USD.
Source: Bloomberg, using the “Strategists S&P 500 Index Estimates for Year-End 2024” as of December 19, 2023
Analyst forecasts and 2024 return are price returns. S&P data © 2025 S&P Dow Jones Indices LLC, a division of S&P Global. All rights reserved. Indices are not available for direct investment; therefore, their performance does not reflect the expenses associated with the management of an actual portfolio.
Risks : Buying Investments can involve risk. The value of your Investments and the income from them can go down as well as up and is not guaranteed at anytime. You may not get back the full amount you invested. Information on past performance is not a reliable indicator for future performance. This information is intended for educational purposes and should not be considered a recommendation to buy or sell a particular security. The views expressed here are subject to change without notice and we can’t accept any liability for any loss arising directly or indirectly from any use of it.
Risks : Buying Investments can involve risk. The value of your Investments and the income from them can go down as well as up and is not guaranteed at anytime. You may not get back the full amount you invested. Information on past performance is not a reliable indicator for future performance. This information is intended for educational purposes and should not be considered a recommendation to buy or sell a particular security. The views expressed here are subject to change without notice and we can’t accept any liability for any loss arising directly or indirectly from any use of it.
To discuss your financial requirements or obtain other information click below
Share this article with your friends by clicking below
Annual Market Review 2024
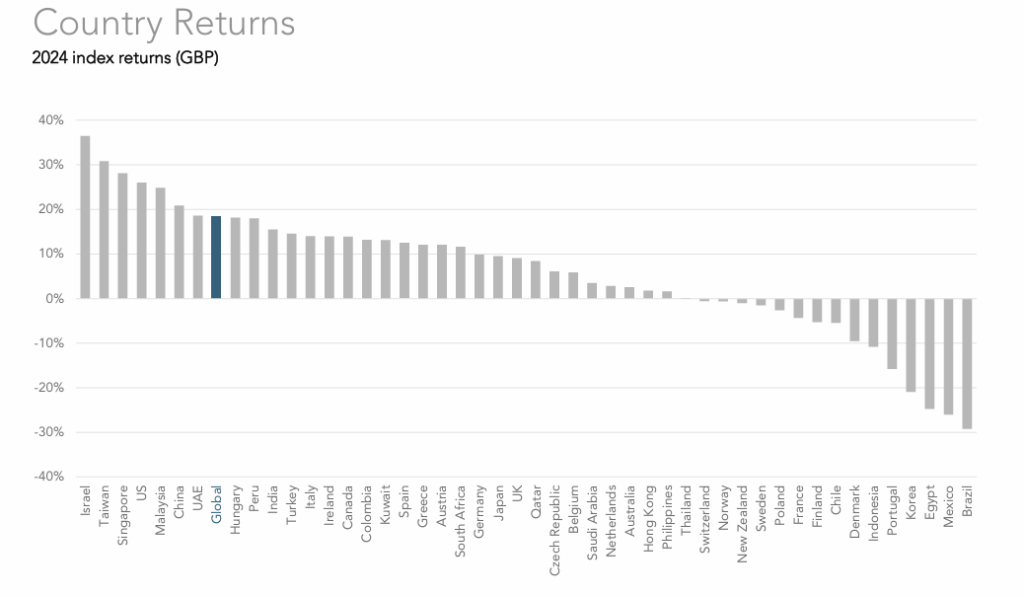
Here's a breakdown of what happened in 2024 . This is for those of you interested in aspects such as which countries returns were higher or whether Value / Growth or Smaller companies performed better in the period.
This is also evidence that maintaining well-diversified, long-term thinking in your investment approach rather than reacting to market swings is key. We can help you develop and monitor carefully considered plans to meet your life objectives for the future which is probably more important to you!
Risks : Buying Investments can involve risk. The value of your Investments and the income from them can go down as well as up and is not guaranteed at anytime. You may not get back the full amount you invested. Information on past performance is not a reliable indicator for future performance. This information is intended for educational purposes and should not be considered a recommendation to buy or sell a particular security. The views expressed here are subject to change without notice and we can’t accept any liability for any loss arising directly or indirectly from any use of it.
To discuss your financial requirements or obtain other information click below
Share this article with your friends by clicking below
MARKET INSIGHTS: MARKET OUTLOOK 2025
Probably unlike most, I enjoy reading Market Outlook Reports from the previous year and compare them with what actually happened! I normally do this in between Christmas and New year when reports are issued for the coming year. These reports look appealing and well put together and include lots of research and graphs.
However making forecasts about the next twelve months turns out not to be a good guide to anything... hence we don’t send them out (ask me if you want to see them anyway).
This chart from Bloomberg shows in pink the range of professional (!) forecasters – UBS, Morgan Stanley, Citi, Wells Fargo, Barclays, etc – for where the US market will finish the year. And the black diamonds show where the market ended up. You can see these forecasts have been overly pessimistic in 4 of the last 5 years.
So given this insight we recommend looking beyond the headlines, focusing on what you can control and sticking with a diversified range of investments to meet your planning goals which is where we can help.
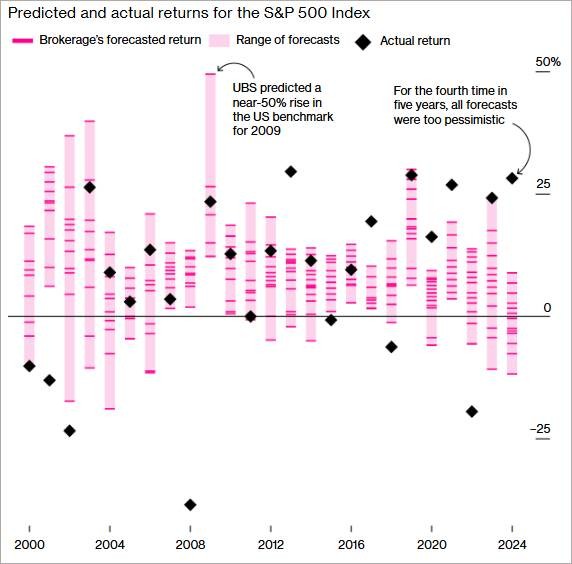
Source: Bloomberg LLP.
Risks : Buying Investments can involve risk. The value of your Investments and the income from them can go down as well as up and is not guaranteed at anytime. You may not get back the full amount you invested. Information on past performance is not a reliable indicator for future performance. This information is intended for educational purposes and should not be considered a recommendation to buy or sell a particular security. The views expressed here are subject to change without notice and we can’t accept any liability for any loss arising directly or indirectly from any use of it.
To discuss your financial requirements or obtain other information click below
Share this article with your friends by clicking below
MARKET INSIGHTS: THE VALUE OF STOCKS AROUND THE WORLD
This infographic seems to be a favourite at client meetings as not many people have seen the World Equity Market Capitalisation presented in this way. This was as at the end of December 2023 where Apple represented 4% of valuations which is quite astonishing when you see that the value of the UK is only c. 4%.
It’s clear the US is the biggest market in the world and why a diversified investment approach taking these weightings into account makes sense.

(Click on image above to zoom)
Source: Dimensional. GBP. Market cap data is free-float adjusted and meets minimum liquidity and listing requirements. Dimensional makes case-by-case determinations about the suitability of investing in each emerging market, making considerations that include local market accessibility, government stability and property rights before making investments. China A-shares that are available for foreign investors through the Hong Kong Stock Connect program are included in China. 30% foreign ownership limit and 25% inclusion factor are applied to China A-shares. Many nations not displayed. Totals may not equal 100% due to rounding. For educational purposes; should not be used as investment advice. Bloomberg data provided by Bloomberg. Diversification neither assures a profit nor guarantees against loss in a declining market.
Risks : Buying Investments can involve risk. The value of your Investments and the income from them can go down as well as up and is not guaranteed at anytime. You may not get back the full amount you invested. Information on past performance is not a reliable indicator for future performance. This information is intended for educational purposes and should not be considered a recommendation to buy or sell a particular security. The views expressed here are subject to change without notice and we can’t accept any liability for any loss arising directly or indirectly from any use of it.
To discuss your financial requirements or obtain other information click below
Share this article with your friends by clicking below
MARKET INSIGHTS:VALUE CAN POP WITHOUT A GROWTH DROP
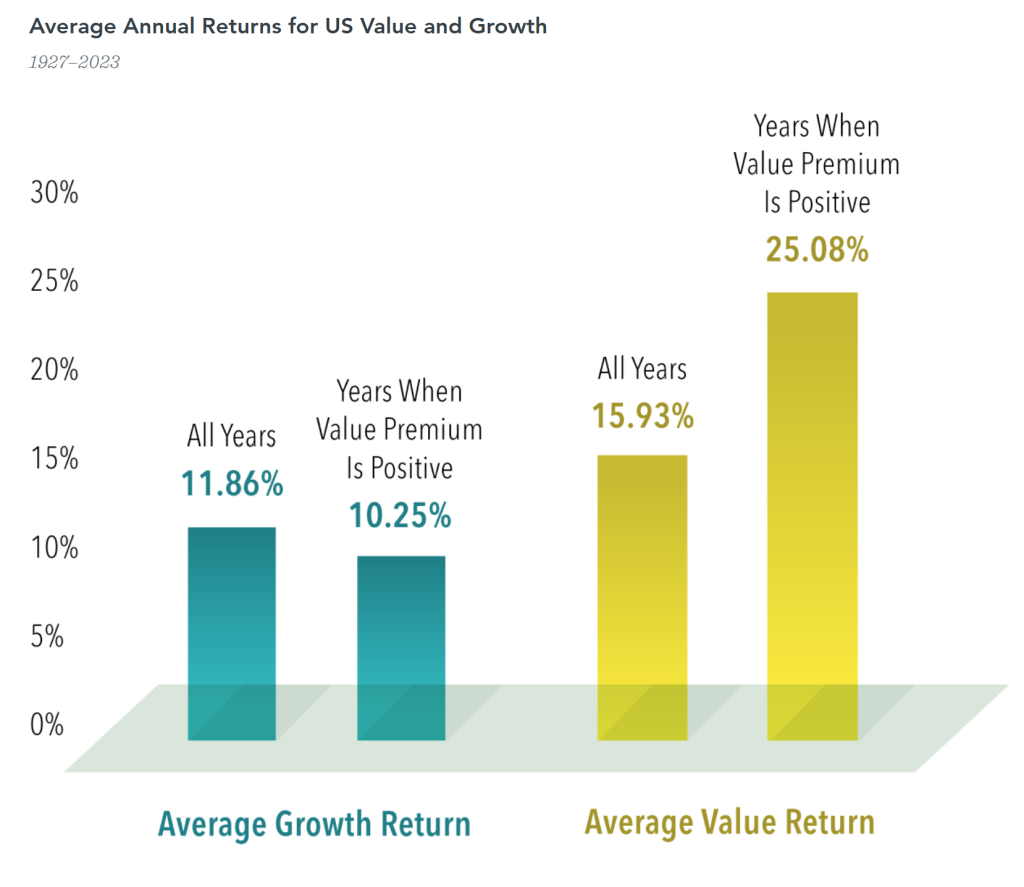
Growth stock stories can be compelling for investors - and make for great news. However it’s worth noting historically that value stocks have outperformed growth stocks in the US (which is the largest stock market in the world by far), often by a striking amount.
Data covering nearly a century backs up the notion that value stocks—those with lower relative prices—have higher expected returns. It’s possible to think value stocks post strong relative returns only because growth stocks underperformed, not because value delivered strong absolute performance.
Since 1927, US value stocks outperformed US growth stocks in 58 out of 97 calendar years. During positive value premium years, growth stocks returned an average of 10.25% compared to their average across all years of 11.86%—lower, but not exactly a tank job. Only in 17 out of 58 positive value premium years was growth’s return negative. On the other hand, value’s average return in positive value premium years, 25.08%, markedly exceeded its long-run average return, 15.93%.
We will take this into account when it comes to saving for your future.
Index Descriptions Fama/French US Value Research Index: Provided by Fama/French from CRSP securities data. Includes the lower 30% in price-to-book of NYSE securities (plus NYSE American-listed equivalents since July 1962 and Nasdaq equivalents since 1973). Fama/French US Growth Research Index: Provided by Fama/French from CRSP securities data. Includes the higher 30% in price-to-book of NYSE securities (plus NYSE American-listed equivalents since July 1962 and Nasdaq equivalents since 1973).
Results shown during periods prior to each index’s inception date do not represent actual returns of the respective index. Other periods selected may have different results, including losses. Backtested index performance is hypothetical and is provided for informational purposes only to indicate historical performance had the index been calculated over the relevant time periods. Backtested performance results assume the reinvestment of dividends and capital gains. Profitability is measured as operating income before depreciation and amortization minus interest expense scaled by book. Eugene Fama and Ken French are members of the Board of Directors of the general partner of, and provide consulting services to, Dimensional Fund Advisors LP
Results shown during periods prior to each index’s inception date do not represent actual returns of the respective index. Other periods selected may have different results, including losses. Backtested index performance is hypothetical and is provided for informational purposes only to indicate historical performance had the index been calculated over the relevant time periods. Backtested performance results assume the reinvestment of dividends and capital gains. Profitability is measured as operating income before depreciation and amortization minus interest expense scaled by book. Eugene Fama and Ken French are members of the Board of Directors of the general partner of, and provide consulting services to, Dimensional Fund Advisors LP
Risks : Buying Investments can involve risk. The value of your Investments and the income from them can go down as well as up and is not guaranteed at anytime. You may not get back the full amount you invested. Information on past performance is not a reliable indicator for future performance. This information is intended for educational purposes and should not be considered a recommendation to buy or sell a particular security. The views expressed here are subject to change without notice and we can’t accept any liability for any loss arising directly or indirectly from any use of it.
To discuss your financial requirements or obtain other information click below
MARKET INSIGHTS: HOW MUCH INFLUENCE DOES THE US PRESIDENT HAVE ON US STOCKS?
In anticipation of tonight’s Presidential Debate there might be questions about how financial markets respond during elections. But the outcome of an election is only one of many inputs to the market. This exhibit examines market data for nearly 100 years of US presidential terms and shows a consistent upward march for US equities regardless of who’s in the Oval Office. This is an important lesson on the benefits of a long-term investment approach.
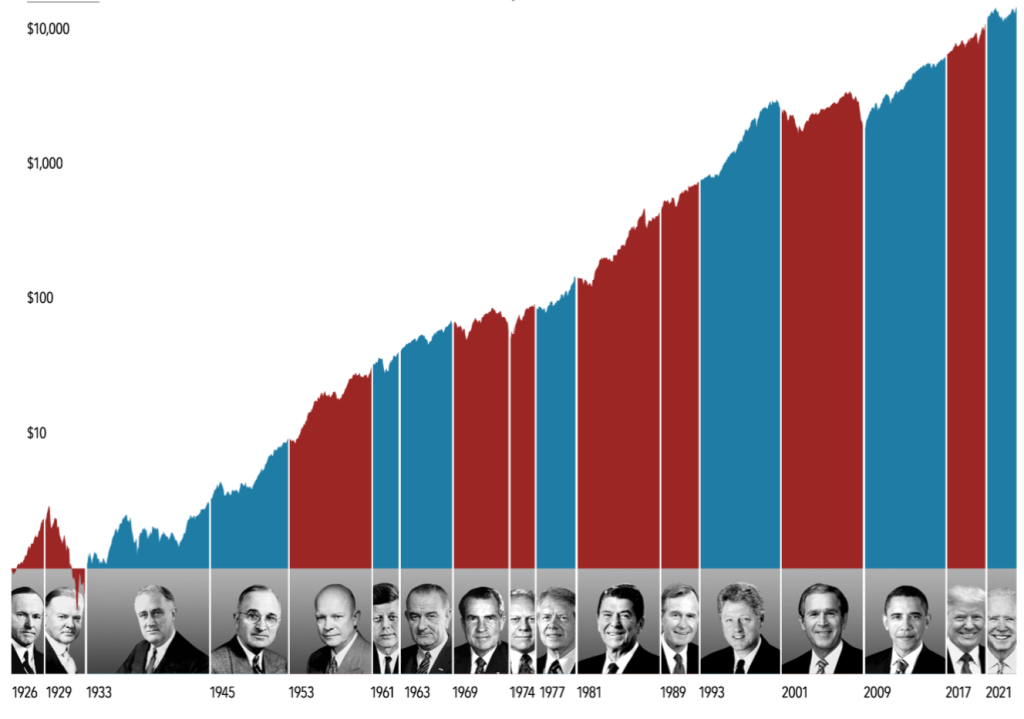
Growth of $1 1926-2023
This material is in relation to the US market and contains analysis specific to the US. In US dollars. Stock returns are represented by the S&P 500 Index. Source: S&P data © 2024 S&P Dow Jones Indices LLC, a division of S&P Global. All rights reserved.
Data presented in the growth of $1 chart is hypothetical and assume reinvestment of income and no transaction costs or taxes.
The chart is for illustrative purposes only and is not indicative of any investment. Growth of wealth for the full sample from January 1, 1926, through December 31, 2023. Growth of wealth for each presidential term starts on the inauguration month of each president up to but not including the inauguration month of a successor. Growth of wealth for Calvin Coolidge's term starts on January 1, 1926, based on the inception date of the S&P 500 Index.
Risks : Buying Investments can involve risk. The value of your Investments and the income from them can go down as well as up and is not guaranteed at anytime. You may not get back the full amount you invested. Information on past performance is not a reliable indicator for future performance. This information is intended for educational purposes and should not be considered a recommendation to buy or sell a particular security. The views expressed here are subject to change without notice and we can’t accept any liability for any loss arising directly or indirectly from any use of it.
To discuss your financial requirements or obtain other information click below
MARKET INSIGHTS: IT'S NOT AS BAD AS YOU THINK
There’s been lots of excitement in the Olympics and also recently in financial markets. So I thought it timely to highlight an interesting paper from Goetzmann, Kim and Shiller (2024) called ‘Emotions and subjective crash beliefs’.
The authors find strong evidence that investors consistently overestimate the probability of a catastrophic stock market crash compared with the historical frequency of such events, and compared with option prices, which are already skewed. They also find that worries rise after unusual exogenous shocks.
For example, investors significantly raise the probability of an earthquake happening after one has happened. Many people will recognise this trait in themselves, with outlook estimates often tainted and adjusted with the benefit of hindsight, reflecting recent events.
Various factors help explain this anxiety. For starters, negative news is more prominent and memorable than positive news. Investors also display loss aversion, so overestimating crash risk is a way to safeguard individuals against potentially irrecoverable personal financial loss.
The authors also note that institutional investors are marginally better calibrated than individuals when estimating crash risk.
An example is in geopolitics. It’s difficult to get an edge in geopolitics when tensions are slowly but gradually increasing, so positioning for an escalation or normalisation is difficult as markets normally slightly overestimate the risks but are no better or worse at pricing that risk than we are.
It’s worth noting that most of these tensions pass with little lasting impact on fundamentals. See the chart below for context which shows you’d be much better off staying invested to achieve your outcomes over time.
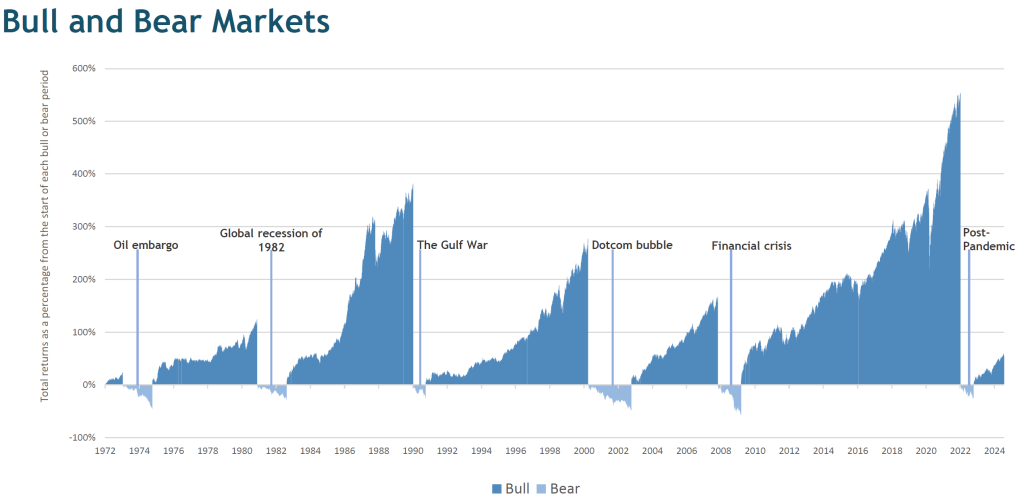
Source: FE Analytics. MSCI World Index from 3rd January 1972 to 30th June 2024.
Index returns do not reflect management fees, transaction costs or expenses. Indexes are unmanaged and one cannot invest directly in an index. Please note that this chart is split up into separate bull and bear periods, each of which begins again from zero. So they can be considered as a series of charts run adjacent to each other. A bull/bear market is defined as a 20% rise/drop from its previous peak with a minimum of 6 months duration. Past performance does not predict future returns.
Index returns do not reflect management fees, transaction costs or expenses. Indexes are unmanaged and one cannot invest directly in an index. Please note that this chart is split up into separate bull and bear periods, each of which begins again from zero. So they can be considered as a series of charts run adjacent to each other. A bull/bear market is defined as a 20% rise/drop from its previous peak with a minimum of 6 months duration. Past performance does not predict future returns.
Risks : Buying Investments can involve risk. The value of your Investments and the income from them can go down as well as up and is not guaranteed at anytime. You may not get back the full amount you invested. Information on past performance is not a reliable indicator for future performance. This information is intended for educational purposes and should not be considered a recommendation to buy or sell a particular security. The views expressed here are subject to change without notice and we can’t accept any liability for any loss arising directly or indirectly from any use of it.
To discuss your financial requirements or obtain other information click below
Share this article with your friends by clicking below
MARKET INSIGHTS: MARKETS TEND TO DISREGARD UK ELECTIONS
As we have all noticed in recent weeks elections generate lots of headlines. So it might seem like an important consideration when making investments Vanguard have analysed the performance of a balanced portfolio of 60% UK shares and 40% UK bonds between January 1987 and May 2024. During that time, there have been 10 general election periods in the UK (including the election on 4 July). They looked at portfolio performance in the period from the five months before each election to the five months after and then compared this with performance during other times and found no statistical difference in portfolio performance!
They also analysed the performance of UK and global stock markets between January 1995 and December 2023, during which period there were seven general elections. The chart below shows that the elections had a minimal impact on stock market performance.
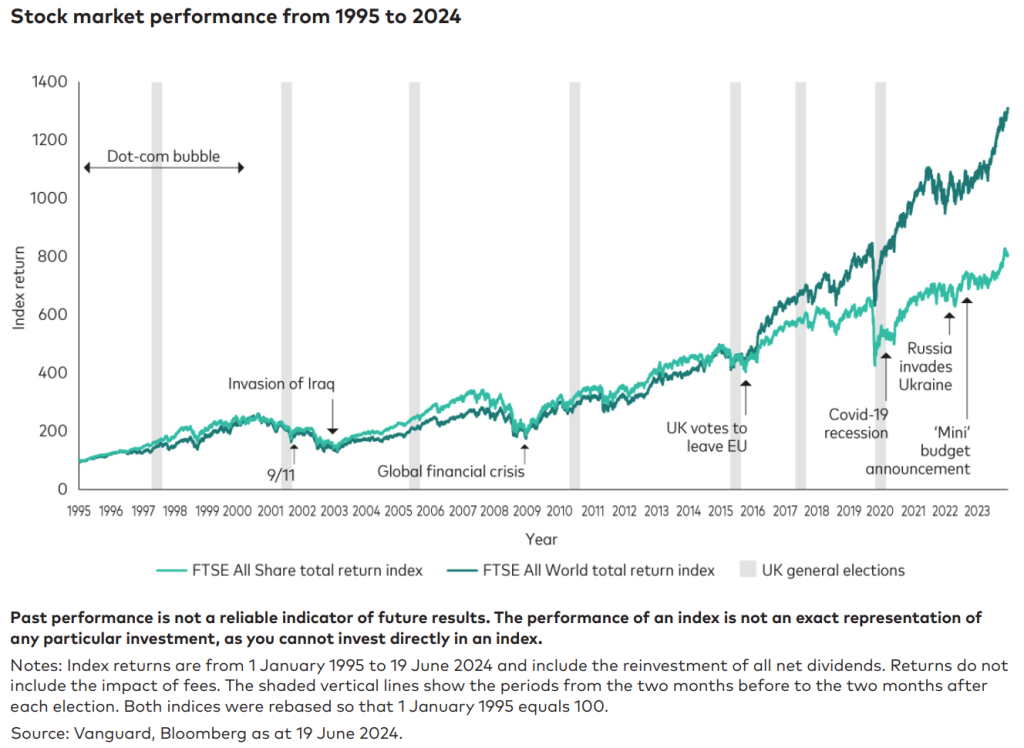
Assessing the implications of a new government and then trying to profit by timing the market rarely works, even for seasoned professionals.
Hopefully the above illustrates that planning with your long term goals in mind, keeping perspective and being disciplined are likely far more rewarding.
Hopefully the above illustrates that planning with your long term goals in mind, keeping perspective and being disciplined are likely far more rewarding.
Risks : Buying Investments can involve risk. The value of your Investments and the income from them can go down as well as up and is not guaranteed at anytime. You may not get back the full amount you invested. Information on past performance is not a reliable indicator for future performance. This information is intended for educational purposes and should not be considered a recommendation to buy or sell a particular security. The views expressed here are subject to change without notice and we can’t accept any liability for any loss arising directly or indirectly from any use of it.
To discuss your financial requirements or obtain other information click below
Share this article with your friends by clicking below
MARKET INSIGHTS: THINK TWICE ABOUT CHASING THE BIGGEST SHARES
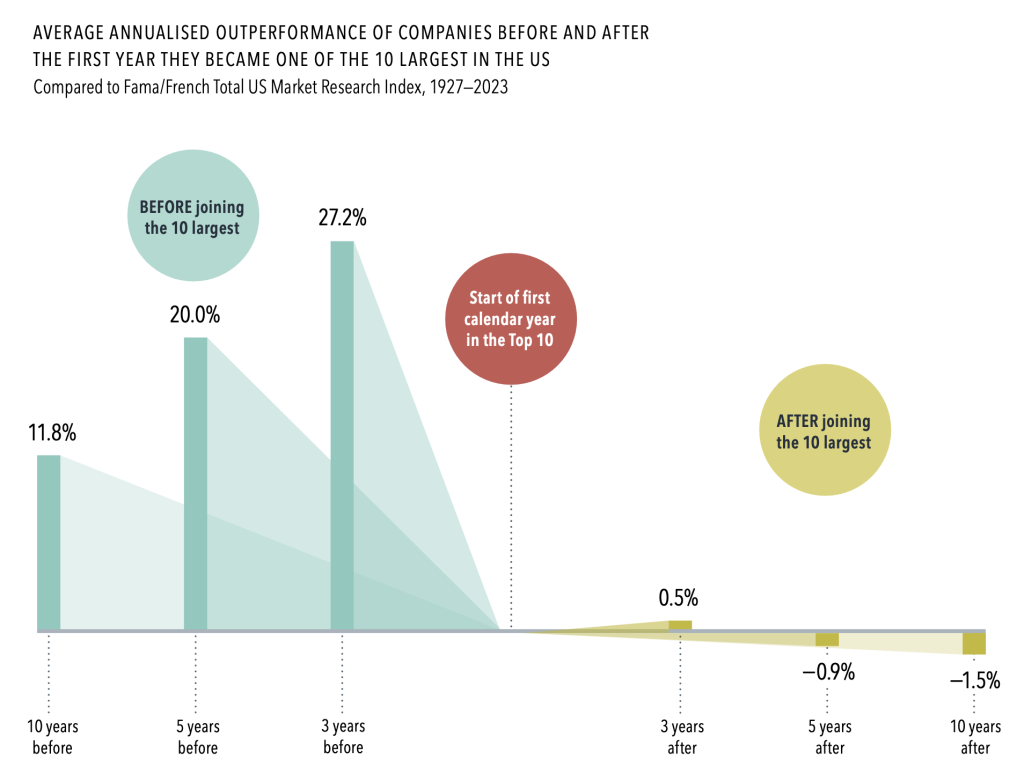
Sometimes it’s a matter of context and history. Looking at the largest equity market in world it’s interesting to note average annualised outperformance of companies before and after the first year they became one of the 10 largest in the US.
BR>
This is a cautionary tale for investors expecting continued outperformance of the biggest companies in the world. In fact, rather than seeking additional exposure to these mega cap shares, investors should ensure their portfolios are broadly diversified to capture the returns of whatever companies ascend to the top in the future.
Past performance is not a guarantee of future results.
As companies grow to become some of the largest on the US stock market, their returns can be impressive. But not long after joining the Top 10 largest by market cap, these shares, on average, have lagged behind the market.
• From 1927 to 2023, the average annualised return for these shares over the three years prior to joining the Top 10 was more than 25% higher than the market.
• Five years after joining the Top 10, these shares were, on average, under performing the market—a stark turn around from before. The gap was even wider 10 years out.
• Given the uncertainty we usually recommend a broad range of investments to reduce risks for our clients.
Expectations about a firm’s prospects are reflected in its current shares price. Positive news might push prices higher, but those changes are not predictable.
Risks : Buying Investments can involve risk. The value of your Investments and the income from them can go down as well as up and is not guaranteed at anytime. You may not get back the full amount you invested. Information on past performance is not a reliable indicator for future performance. This information is intended for educational purposes and should not be considered a recommendation to buy or sell a particular security. The views expressed here are subject to change without notice and we can’t accept any liability for any loss arising directly or indirectly from any use of it.
To discuss your financial requirements or obtain other information click below
Share this article with your friends by clicking below