

MARKET INSIGHTS:VALUE CAN POP WITHOUT A GROWTH DROP
Growth stock stories can be compelling for investors - and make for great news. However it’s worth noting historically that value stocks have outperformed growth stocks in the US (which is the largest stock market in the world by far), often by a striking amount.
Data covering nearly a century backs up the notion that value stocks—those with lower relative prices—have higher expected returns. It’s possible to think value stocks post strong relative returns only because growth stocks underperformed, not because value delivered strong absolute performance.
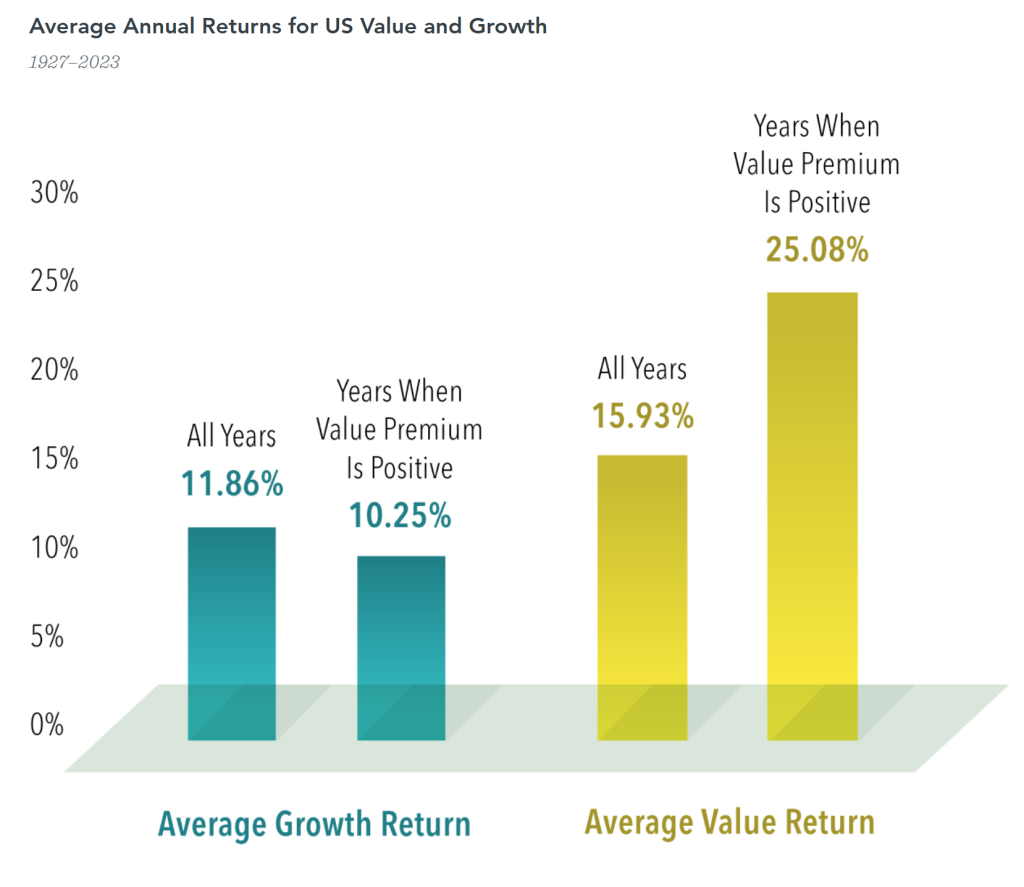
Since 1927, US value stocks outperformed US growth stocks in 58 out of 97 calendar years. During positive value premium years, growth stocks returned an average of 10.25% compared to their average across all years of 11.86%—lower, but not exactly a tank job. Only in 17 out of 58 positive value premium years was growth’s return negative. On the other hand, value’s average return in positive value premium years, 25.08%, markedly exceeded its long-run average return, 15.93%.
We will take this into account when it comes to saving for your future.
Index Descriptions Fama/French US Value Research Index: Provided by Fama/French from CRSP securities data. Includes the lower 30% in price-to-book of NYSE securities (plus NYSE American-listed equivalents since July 1962 and Nasdaq equivalents since 1973). Fama/French US Growth Research Index: Provided by Fama/French from CRSP securities data. Includes the higher 30% in price-to-book of NYSE securities (plus NYSE American-listed equivalents since July 1962 and Nasdaq equivalents since 1973).
Results shown during periods prior to each index’s inception date do not represent actual returns of the respective index. Other periods selected may have different results, including losses. Backtested index performance is hypothetical and is provided for informational purposes only to indicate historical performance had the index been calculated over the relevant time periods. Backtested performance results assume the reinvestment of dividends and capital gains. Profitability is measured as operating income before depreciation and amortization minus interest expense scaled by book. Eugene Fama and Ken French are members of the Board of Directors of the general partner of, and provide consulting services to, Dimensional Fund Advisors LP
Results shown during periods prior to each index’s inception date do not represent actual returns of the respective index. Other periods selected may have different results, including losses. Backtested index performance is hypothetical and is provided for informational purposes only to indicate historical performance had the index been calculated over the relevant time periods. Backtested performance results assume the reinvestment of dividends and capital gains. Profitability is measured as operating income before depreciation and amortization minus interest expense scaled by book. Eugene Fama and Ken French are members of the Board of Directors of the general partner of, and provide consulting services to, Dimensional Fund Advisors LP
Risks : Buying Investments can involve risk. The value of your Investments and the income from them can go down as well as up and is not guaranteed at anytime. You may not get back the full amount you invested. Information on past performance is not a reliable indicator for future performance. This information is intended for educational purposes and should not be considered a recommendation to buy or sell a particular security. The views expressed here are subject to change without notice and we can’t accept any liability for any loss arising directly or indirectly from any use of it.
To discuss your financial requirements or obtain other information click below